
Silica sand Contents & features
Our guarantees regarding the composition of treated silica sand and the full chemical analysis of the raw sand from the Djebel Ouazzan deposit.
From the deposit to the laboratory
Silica sand with a purity of audited
From extraction at Djebel Ouazzan through to laboratory analysis, every batch of silica sand is monitored to ensure that its composition remains consistent and meets our requirements.
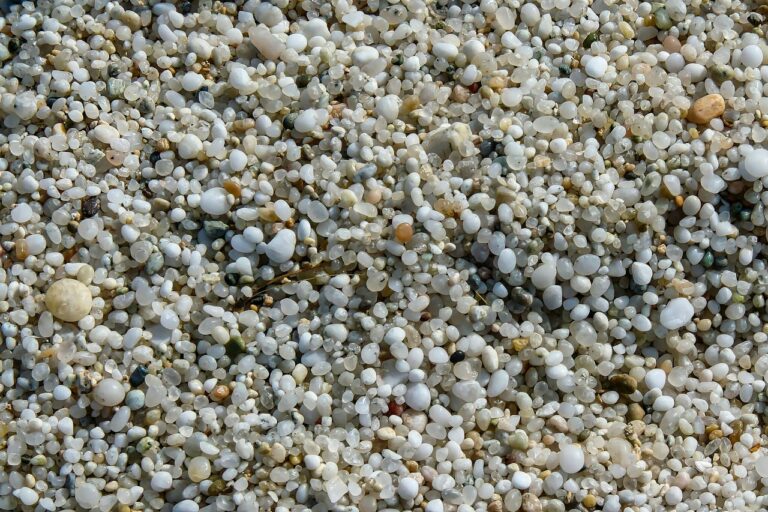
Contents standards treated silica sand
SiO₂ > 98 %
Guaranteed purity in treated silica sand — the benchmark for the glass and foundry industries.
Al₂O₃ < 0.5 %
CaO < 0.5 %
MgO < 0.1 %
H₂O < 2 %
10 µm — 3 mm
< 5 %
Maximum impurity level — systematic batch analysis prior to dispatch.
Target composition of the treated silica sand
Features chemical unprocessed sand
| Content (%) | SiO₂ | Al₂O₃ | Fe₂O₃ | CaO | MgO | PF |
|---|---|---|---|---|---|---|
| Min | 87,66 | 0,68 | 0,24 | 0,92 | 0,15 | 1,44 |
| Moy | 92,12 | 1,48 | 0,46 | 2,29 | 0,23 | 2,74 |
| Max | 96,06 | 2,24 | 0,60 | 3,99 | 0,28 | 4,18 |
Min · Avg · Max ranges
Each line is normalised to its own maximum value. The diamond marks the mean.
PF = loss on ignition. Values derived from analyses of raw sand prior to treatment. The standard contents given above refer to finished silica sand, after washing and treatment.
Features physical unprocessed sand
| Measurement | ≤ 0.850 mm | 0.100 – 0.630 mm | ≤ 0.100 mm | M.V. (absent). | M.V. et al. | H₂O | Clay |
|---|---|---|---|---|---|---|---|
| Min | 16,72 | 68,34 | 15,82 | 2,36 | 1,51 | 0,5 | 1,35 |
| Moy | 1,94 | 53,32 | 12,71 | 2,48 | 1,49 | 0,3 | 4,10 |
| Max | 23,33 | 85,35 | 22,34 | 2,56 | 1,52 | 0,7 | 6,36 |
Min · Avg · Max ranges
Each line is normalised to its own maximum value. The diamond marks the mean.
Sieve loss expressed as %, bulk densities in g/cm³, moisture content and clay content as %. Values derived from physical analyses of the raw sand.